
San Antonio is a great city. According to Yelp, there are over 1200 places to get a taco - how could it not be great?
Unfortunately, any time you get a huge group of people together there will be crime, and SA is no exception. Our SAPD stay busy 24/7, constantly putting their lives on the line to keep the city safe, and I’m thankful for all the work they do.
Being an amateur API aficionado, I was excited to find the SAPD Open Data Initiative that contains a wealth of information on the activities the SAPD perform. Specifically, I wanted to see what kinds of analytics I could gather from exploring the historic SAPD call data.
In this post, I’ll explain how I was able to gather and analyze 4.3 million call data records, or how I basically became the extremely boring part of Batman.
Getting the Call Data
A Little About the Format
The first thing we have to do is get the call data. As part of the Open Data Initiative, SAPD publishes historical calls on their website. This interface lets you search through calls that were responded to by an SAPD officer dating back to January 1, 2011.
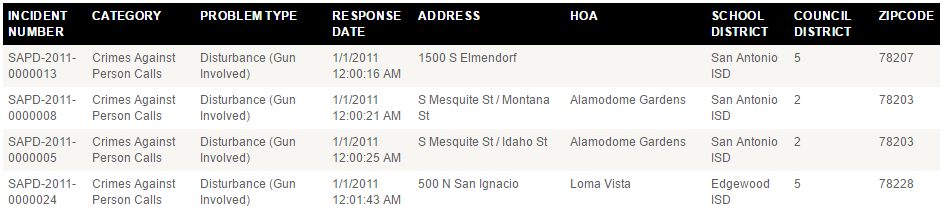
Each call record has the following details:
- Incident Number - A unique identifier for the call in SAPD-YYYY-xxxxxxx format
- Category - The category of the call (e.g. “Crimes Against Person Calls”)
- Problem Type - The sub-type of the call that narrows down from the root category (e.g. “Robbery of Individual”)
- Response Date - The date/time a response was given to the call
- Address - The address where the incident occurred
- HOA - The Homeowner’s Association where the incident occurred (if applicable)
- School District - The school district where the incident occurred
- Council District - The council district where the incident occurred
This is a ton of great data. However, searching through the data manually is a pain, and I didn’t see any obvious bulk export feature. Time to get out the whiskey and BeautifulSoup and get to scraping.
Scraping the Data
Scraping the site turned out to be a chore for multiple reasons, the first of which was due to the SSL configuration in use. I wound up having to use a custom TLS adapter just to get the requests library to negotiate a TLS connection.
Then I had to address the restrictions on how I could search. I had to filter by a certain category and I could only get at most 10k results per query. To put things in perspective, that lets me usually get a week of calls labelled as “Other”.
No one can say our officers aren’t busy.
I ended up hacking together a scraper that ran like this:
- For every category
- Try to get a week’s worth of calls
- If # calls = 10000
- Get that week a day at a time to make sure we don’t miss anything
- Store the results
Here’s the current code - be warned, it’s hacky. I was manually changing the categories to make sure things were going smoothly, so YMMV.
After finishing up the scraping, I was left with 4.3 million records to work with.
Analyzing the Data
After grabbing all the data, I wrote a quick script to dump it into ELK. Loading up Kibana, we see our sweet, sweet data.
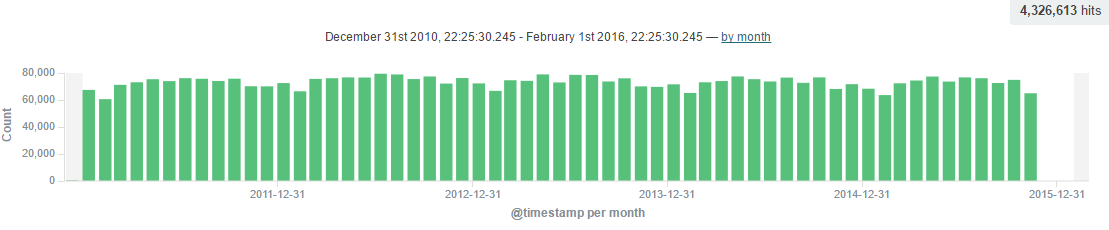
We can immediately see that calls are surprisingly consistent in terms of frequency. Digging into the data, we can find some other neat insights:
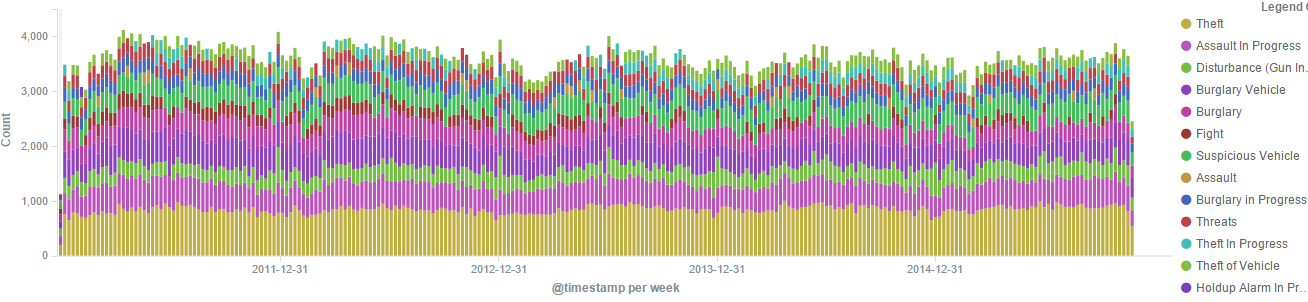
Theft and Crimes Against People
I started filtering the data looking for theft/burglary and crimes against people. Looking at the top 10 call types, the generic call description of “theft” was consistently the highest:
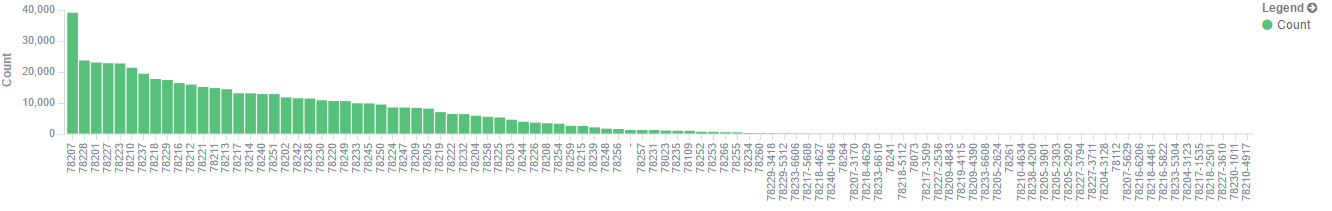
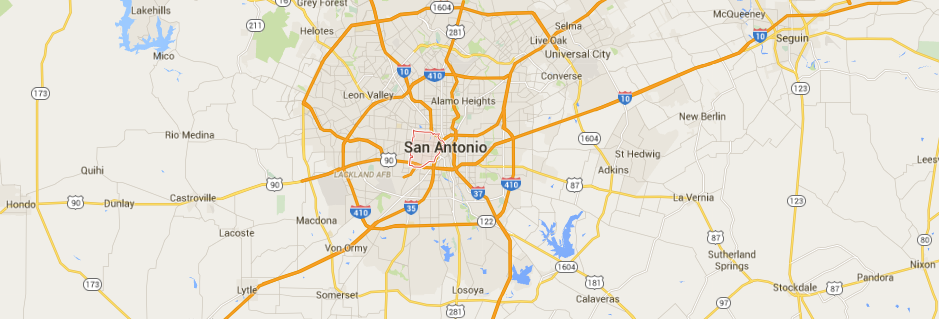
With this data, it was easy to track down the most dangerous zip code and address by filtering to just the “crimes against persons” category. With right around 40k calls, zipcode 78207 (mapped below) accounts for 7.1% of all crimes against people:
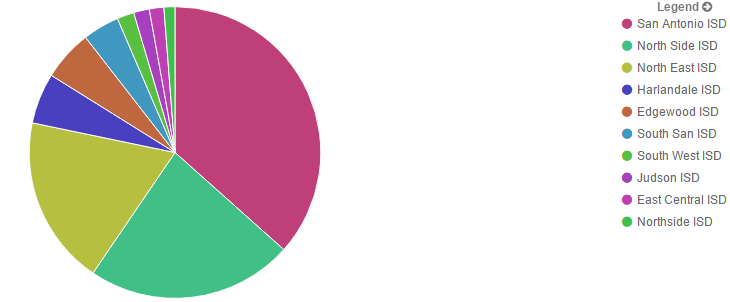
We can do the same filtering to find the most dangerous school district - San Antonio ISD comes in the highest at 196k calls, which is around 36%:
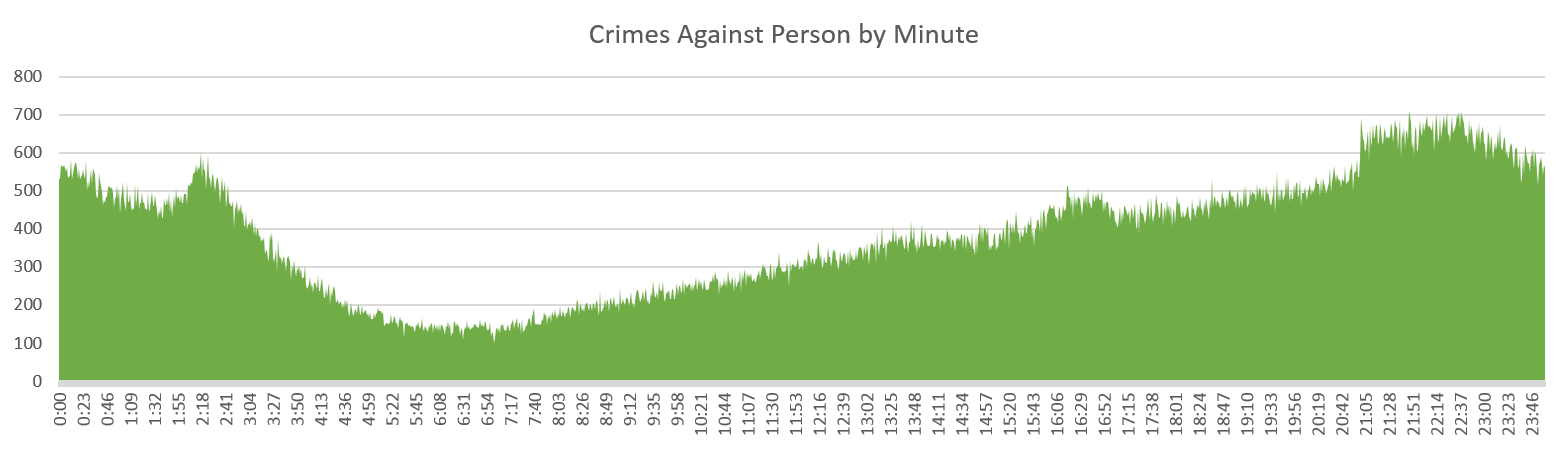
When Does Crime Happen?
This was an interesting one, since I couldn’t find a good way to display this in Kibana. To Python, more whiskey, and Excel we go. I wrote a quick script to parse the “Crimes Against Persons” calls to find the distribution by minute. Obviously, this will depend on where you live, what time of the year it is, etc. but here is the graph:
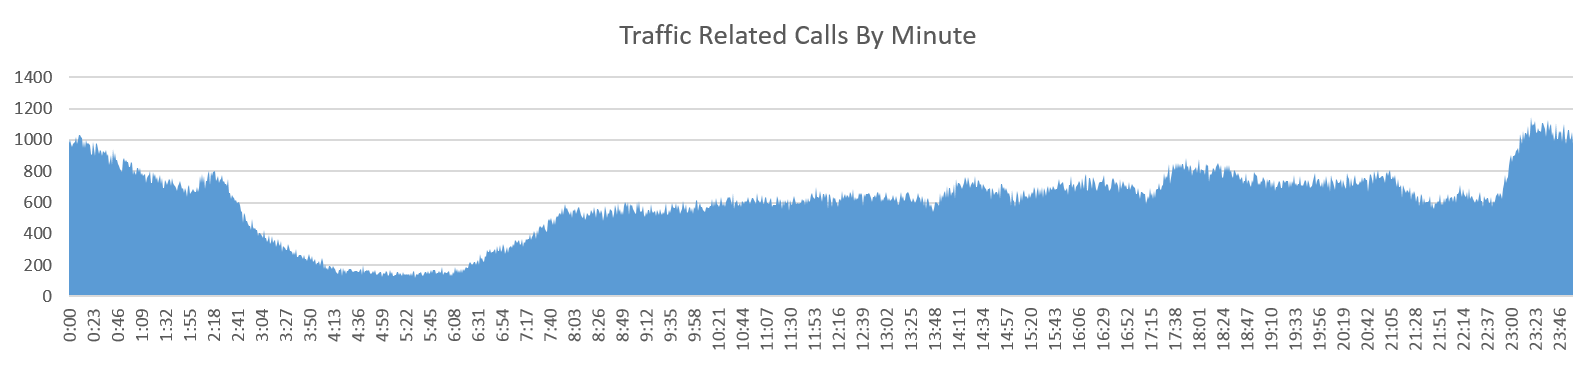
Traffic Related Calls
The calls labelled as “traffic related” deal with traffic stops, DWIs, etc. I did the same analysis as before to find out when most traffic related calls happen and got these results:
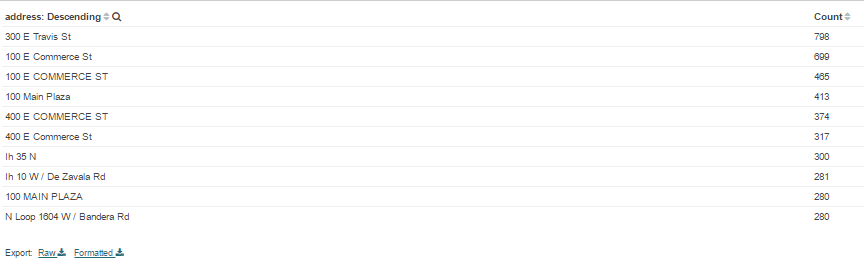
Looking at the top addresses for traffic stops and DWI’s, we see that downtown is the place where most incidents happen:
Other Calls
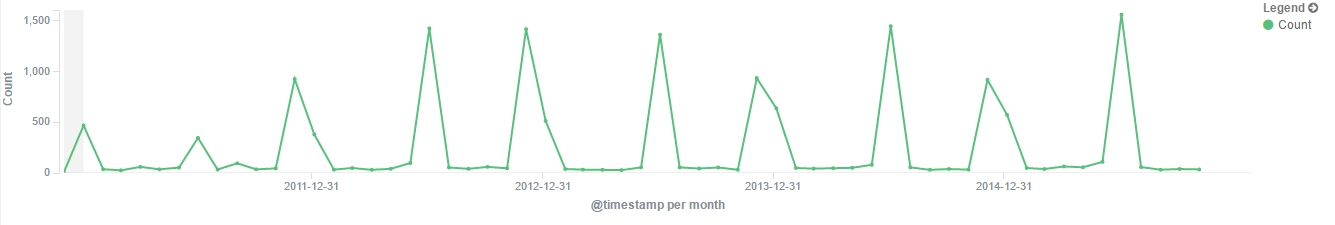
The “other” category gives some interesting datapoints - most of these deal with various disturbances. For example, we can see that the number of “fireworks disturbance” calls always spikes around July 4th, New Year’s Eve, and my birthday not really.
Issues with Geocoding
It was my original intent to geocode the records so that I could plot them in a heatmap fashion. Unfortunately, I ran into a couple of challenges:
Finding a geocoder - Even though there are only about 233k unique addresses found in the data, I still ran into issues finding a free service to geocode that many addresses. I started working with Mapzen (which is pretty awesome), when I discovered my other problem:
Generic Addresses - Many of the addresses in the dataset are incredibly vague. For example, the address with the most number of “traffic related” calls? “IH 10 W”, followed by “NW Loop 410”. Go figure.
Both of these made it difficult to come up with meaningful heatmaps to show crime over the SA region. If anyone has any ideas, hit me up.
Sweet, Sweet Dashboards
One of the best parts about the ELK stack is the ability to create dashboards like this one:
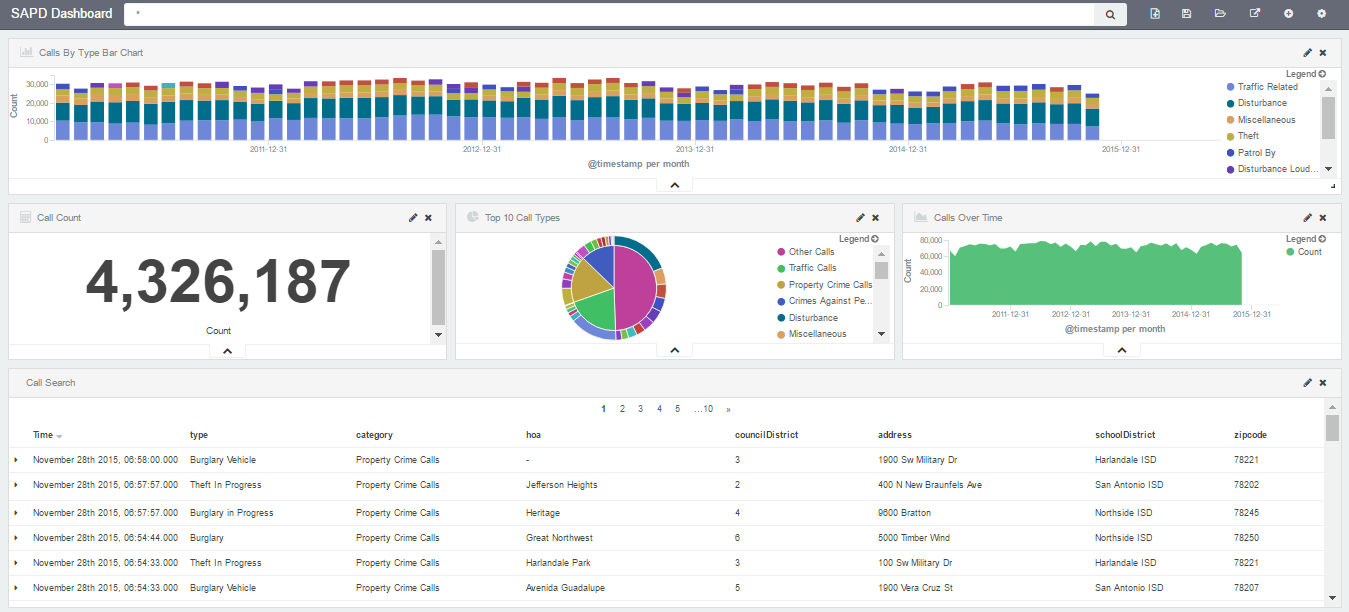
This dashboard gives a great overview of the call details, with the ability to drill down into the calls you care about.
I don’t think it’s any stretch to say that having this visibility into crime across the city basically makes me the boring part of Batman. After all, have you ever seen Batman and me in the same room?
Didn’t think so.

Have Some Data
Since the purpose of this open data initiative was to share information with the community, I want to do my part by making the dataset available as JSON so that people who are much better than me at analyzing large data sets can find new insights that will help make SA a safer place to live.
The dataset contains all records from January 1, 2011 to November 30, 2015, which was when I pulled the data.
You can download the full dataset here.
Let’s help our officers make this city safer.
-Jordan (@jw_sec)